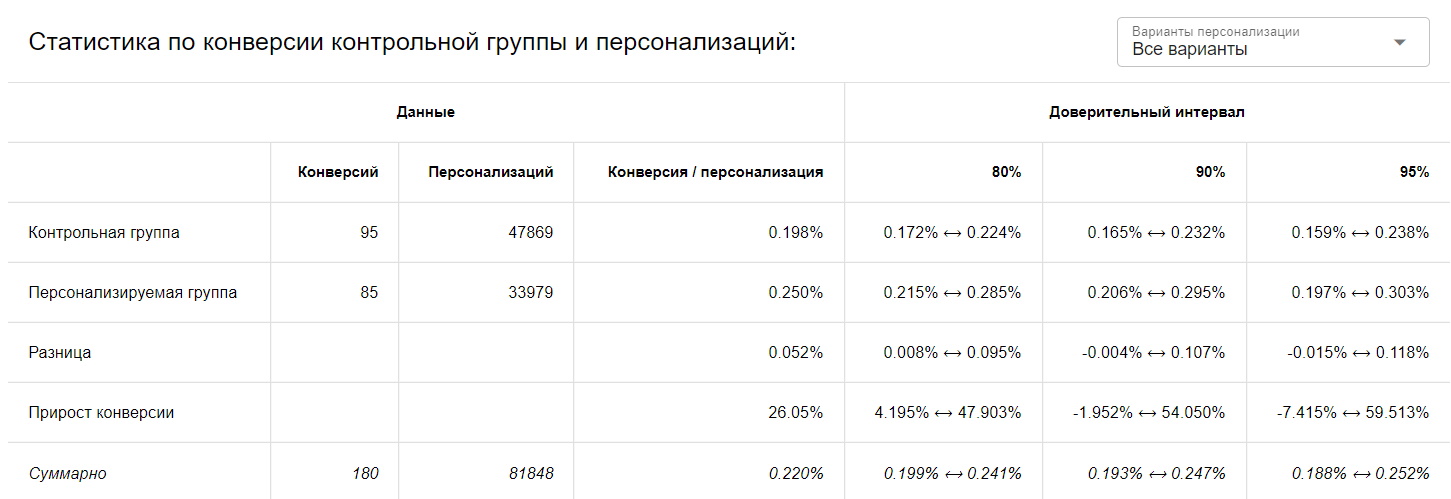
# Personalization statistics
The personalization statistics window allows you to evaluate the quality of personalization. Compare the conversion rates in the control and personalized groups relative to the specified conversion.
Below, we will look at the main features and aspects of the statistics.
# Filters

Personalization filters are settings that allow you to precisely specify the parameters of the statistics to be calculated.
Filters in the list are applied through the logical AND operation (opens new window) (not OR).
For example, if the filter specifies dates from 24.06.2022 to 28.06.2022 and version 3 of the model, then only those personalization events that fall within the specified range and belong to version 3 of the personalization model will be considered in the statistics.
# Period (in UTC)
This is a time interval (from and to a specific date) within which personalization and conversion events are selected.
The time is considered in UTC (opens new window), not in the user's local time.
The "from" date is applied starting from 0 hours, 0 minutes, and 0 seconds. The "to" date is applied until 23 hours, 59 minutes, and 59 seconds.
Therefore, if the time period from 24.06.2022 to 28.06.2022 is set, the time from 24.06.2022 00:00:00 to 28.06.2022 23:59:59 is considered.
# Grouping
The "Grouping" parameter determines how the data should be grouped on the charts.
There are three options:
- Day
- Week
- Month
Some types of groupings may be unavailable if the selected display period is too short.
Example of displaying the same data with grouping by days:

And weeks:

As you can see, the dynamics of our personalization's success on a daily basis were mixed and it was difficult to visually assess the result.
But using weekly grouping, the result looks much more intuitive.
# Goal list
The goal list allows you to select one or more goals, the achievement of which will be considered a conversion.
You can view statistics not only for those goals that are specified in the personalization, but also for any others that are set in your project.
# Consider only the first conversion for each user
If this option is enabled, we will only consider the first conversion for each user in the statistics.
Also, see the corresponding field when creating personalization.
# Default filters
When opening the statistics page for a personalization, we automatically calculate the optimal filters for your convenience.
How the default model versions are calculated:
If the personalization is in the testing process (not yet statistically proven), we select the versions of the models from the end, the combination of which is closest to statistical significance.
If the personalization is already statistically proven, we select the versions of the models from the end, the combination of which was used in the last conversion rate growth update.
If the personalization is still collecting data, all versions of the model will be selected
After calculating the default model versions, we set the start date of the period as the creation date of the earliest model version.
The parameter "Consider only the first conversion for each user" is set by default if the same parameter is enabled for the personalization itself.
# Statistics table

The following articles will help you understand the statistics table:
# Current model information
At the bottom of the statistics window, you can see brief information about the current (latest) model used for personalization:

The data shown is an interpretation of the model's performance on a small portion of the evaluation data from the control group, which was not used in training.
This data is not an exact prediction (at least because the traffic structure is constantly changing) - the conversion rate may change over time, as well as the optimal distribution of personalization options.
However, it allows us to some extent to interpret the model (not to mention that it is simply interesting 😀).
For example, the above picture shows a real model in an online store. For products that are left in a single copy, personalization replaces (or not) the label "One item" with "Several".
The initial hypothesis was that some people would decide to buy faster knowing that only 1 item is left. Others might be scared off, thinking the last item is a display sample.
Looking at the resulting numbers, we can assume the following:
The vast majority of people avoid ordering the last sample. It is slightly more advantageous for them to show that a few more pieces are left (achieving a small increase in conversion from 0.15% to 0.16%).
But for a small group of people, "One item" is indeed a good signal to provoke a purchase (conversion increased from 0.15% to 0.54%).
# Frequently asked questions
# How are conversions considered if there was no prior personalization?
Suppose we have a personalization "Add to cart button text". We optimize it relative to the goal "Order completed".
But what if the user reaches the goal "Order completed", but did not have the personalization "Add to cart button text" (or the personalization did not fit the specified filter)?
In this case, the conversion is simply not considered.
# There were several personalizations before the conversion. Which one will be considered for the conversion?
Suppose a user visited our website multiple times before making a conversion. During all this time, we showed them personalization several times:
- Personalization (option 1, control group)
- Personalization (option 2, control group)
- Personalization (option 2, personalized group)
- Conversion
- Personalization (option 2, control group)
Personalization (option 2, personalized group) - step number 3 - will be considered as the personalization that led to the conversion.