# Credible interval

Wikipedia about confidence intervals (opens new window)
To obtain a definitively accurate result, such as user conversion to order placement, we would need every internet user in the world to attempt placing an order in our online store.
Since we cannot do this, we can only discuss our current value (e.g., conversion rate) and the credible interval.
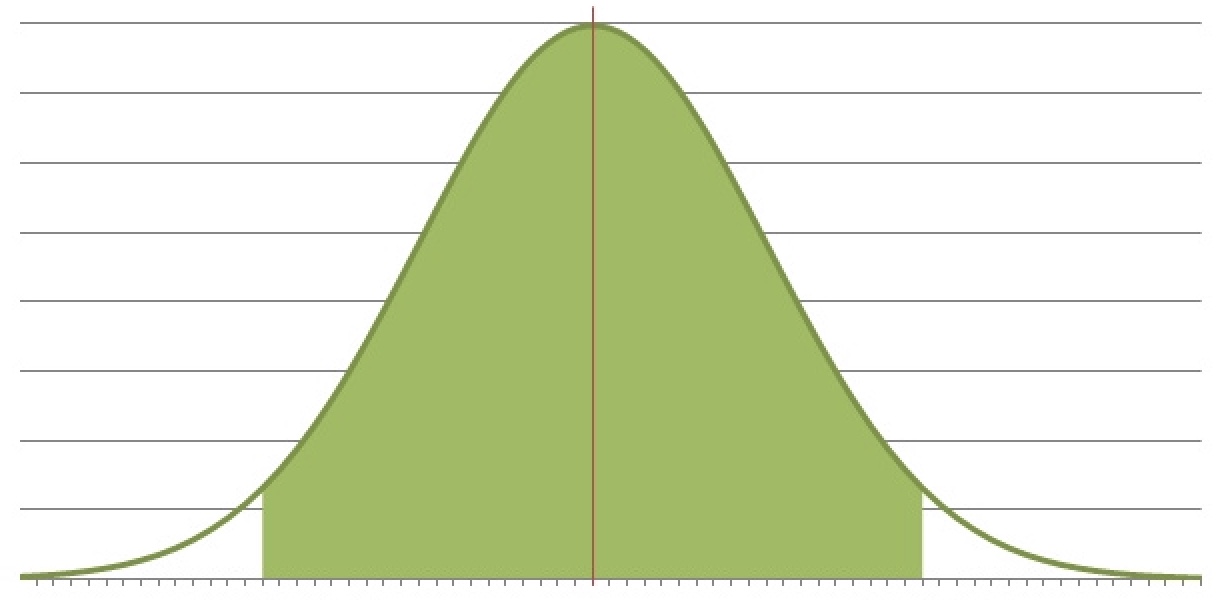
A credible interval is a range within which the "true value" of the parameter we seek lies. The closer the value is to the average, the higher the probability that it is the "true" value.
For example, we have:
- 95 orders placed
- by 47950 clients
Simple calculations show that the average conversion rate is ~0.198%.
With the addition of new data (information about new clients and orders), the conversion rate will fluctuate. However, based on the existing data, we can calculate credible intervals:
| Credible interval | Value |
|---|---|
| 80% | 0.172% ⟷ 0.224% |
| 90% | 0.165% ⟷ 0.231% |
| 95% | 0.158% ⟷ 0.238% |
Now, we can assert that based on the available data, with 90% probability, the "true" conversion rate is somewhere between 0.165% and 0.231%.
With 5% probability, the "true" conversion rate is less than 0.165%. With 5% probability, the "true" conversion rate is greater than 0.231%.
A credible interval can be applied not only to conversion rates (or any other statistically measurable parameter) but also to the difference between two conversion rates (or any other parameters).
For example, here is a real personalization example (data for the first example is taken from there):

The credible interval of the difference is highlighted in red.
This means a range within which the difference between two parameters lies (in this case, the credible interval of the conversion rate increase).
In the above example, we can say that with 80% probability, the credible interval of conversion rate increase lies between 0.011% and 0.098%.